India’s Unchanging Statistic: 400 Million Poor Over 30 Years
| Highlights * India has 400 million people in poverty - a number relatively unchanged since 1981 when 429 million were very poor * Sub-Saharan Africa has 34% of poor population of the world while India has the second largest number - around 33% - of poor people in the world *China has reduced the number of poor people from 835 million in 1981 to 156 million in 2010 |
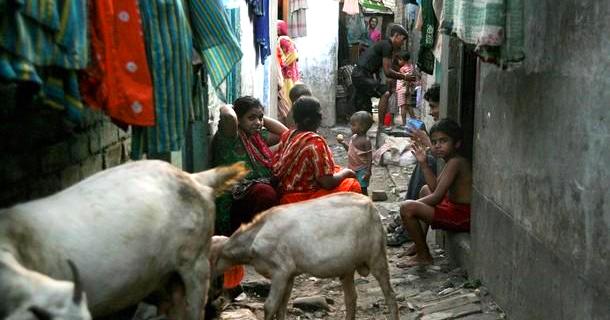
It’s a sharp contrast: India has the fifth highest number of billionaires in the world. There are no dearth for buyers for super cars with an entry level Lamborghini, the Gallardo, costing about $550,000 (over Rs 3 crore) in a country where 33% of the population or 400 million people (100 million more than the entire population of the United Stateslive on less than $1.25 (around Rs 70) per day.
More than the contrast, what’s clear is that fighting poverty is a tough job. There were 429 million Indians living in poverty in 1981 and there were 400 million in 2010. So while the percentage numbers look good, down from 60% to 33%, the absolute numbers do not.
So, accounting for increase in population, this is one battle India is not quite winning, yet. Interestingly, in the same period, China brought its absolute poor down from 835 million to 156 million. Moreover, as a total percentage, India and sub-Saharan Africa have almost the same percentage share of the world’s poor.
A recent World Bank report said that extreme poverty across the globe has reduced significantly in the last three decades with the number of people living on less than $1.25 per day down from 50% to 21%.
This even though there has been an increase of 59% in population of the developing countries. One reason for this reduction is that China has pulled out a significant number of people out of extreme poverty while India is stilllagging in that regard.
Figure 1
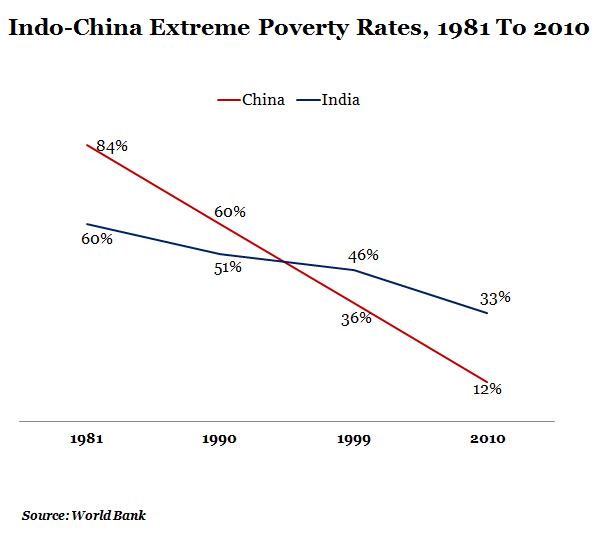
India has managed to reduce its extreme poverty rates from 60% to 33% from 1981 to 2010 – a decline of (45%). China, on the other hand, has managed to bring down its percentage of people out of extreme poverty from 84% in 1981 to 12% in 2010 – a sharp reduction of (85%).
Not surprisingly, perhaps, India’s success in bringing down extreme poverty has been the highest in the last decade (1999-2010) – also the decade that saw economic growth following liberalisation in 1991. Similarly, China’s poverty rates fell after China liberalised its economy in 1978. However, the story changes when you look at the actual number of poorpeople.
Figure 2
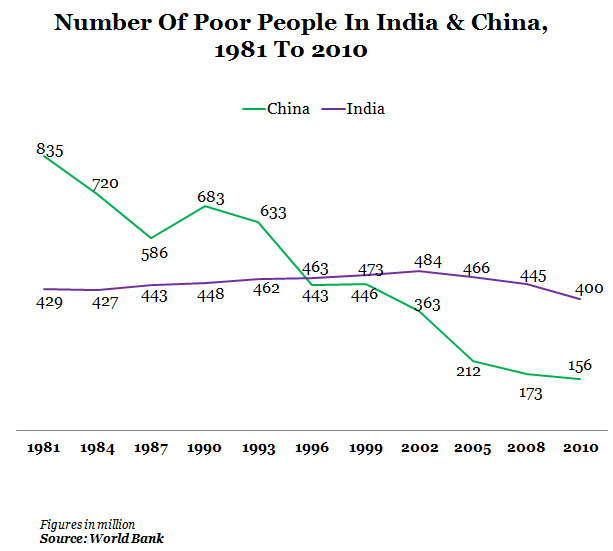
While the extreme poverty rate went from 60% in 1981 to 33% in 2010 –the actual number of people in extreme poverty in India didn’t change that much --it only went from 429 million in 1981 to 400 million in 2010 – or 29 million less extremely poor people. And there were variations even within that period: from 1981 to 2002, there was an increase of 55 million poor people and then the number started to decline.
Figure 3
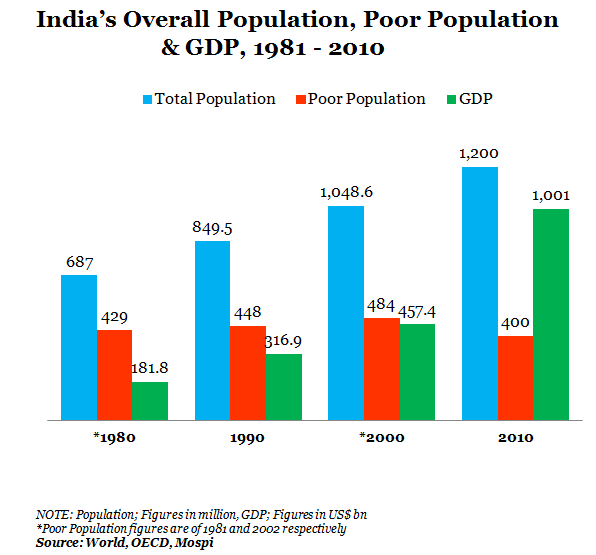
The graph above shows the total population compared to the poor population and the GDP growth from 1981 to 2010.Though India’s drop is not nearly as significant compared to China’s, it’s interesting to note that major drop in the number of poor occurred from 2002 onwards – over 80 million people moved out of the extreme poverty trap (the numbers fell from 484 million to 400 million in 2010).
While the growth in the economy is a key factor, the other explanation may be flagship schemes targeting this population...Mahatma Gandhi National Rural Employment Guarantee Act (MGNREGA), has led to higher wages in the rural areas.
More than 14 billion person-days of employment have been generated under MGNREGA till March 2013. And an average of 50 million households have been provided employment every year since 2008. 30 new jobs were included recently under MGNREGA like irrigation and flood management, fisheries, rural drinking water and sanitation-related work.
MGNREGA guarantees 100 days of wage-employment in a financial year to a rural household whose adult members volunteer to do unskilled manual work. The Act came into force in February 2, 2006, and is now in operation in 632 districts in the country.
The bottom line is India still contributes around 33% of the extremely poor people in the world, up from 22% in 1981. China comes third contributing about 13%, down sharply from 43% in 1981.
Figure 4
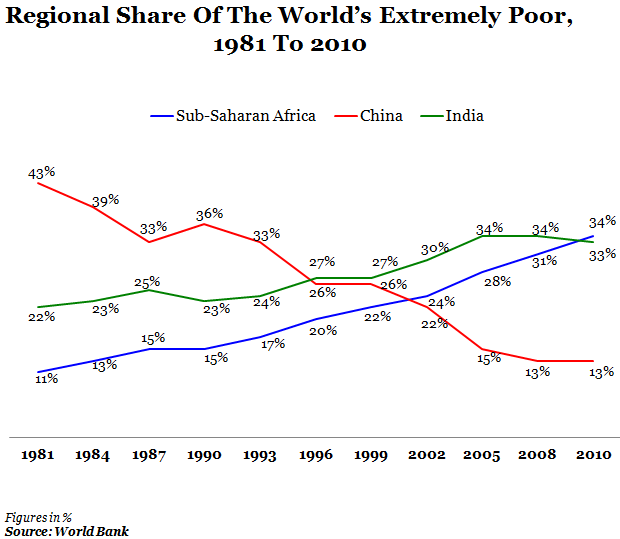
From the table above, it’s evident that sub-Saharan Africa was earlier in the third position with a 11% share in 1981. It has now moved to the 1stposition by replacing China with 34% of the extremely poor population of the world.
China has reduced the number of poor (read extreme) people from 835 million in 1981 to 156 million in 2010...and is currently third in the ranking....
India, surprisingly, moved from the third position in 1981 to the 1st position from 1996 till 2008. And is currently placed second with 400 million extremely poor people.... so, the challenges are clear for the policy makers.